/metrics on port 8376.
For production deployments, consider securing the metrics endpoint with HTTP Basic Authentication.Set
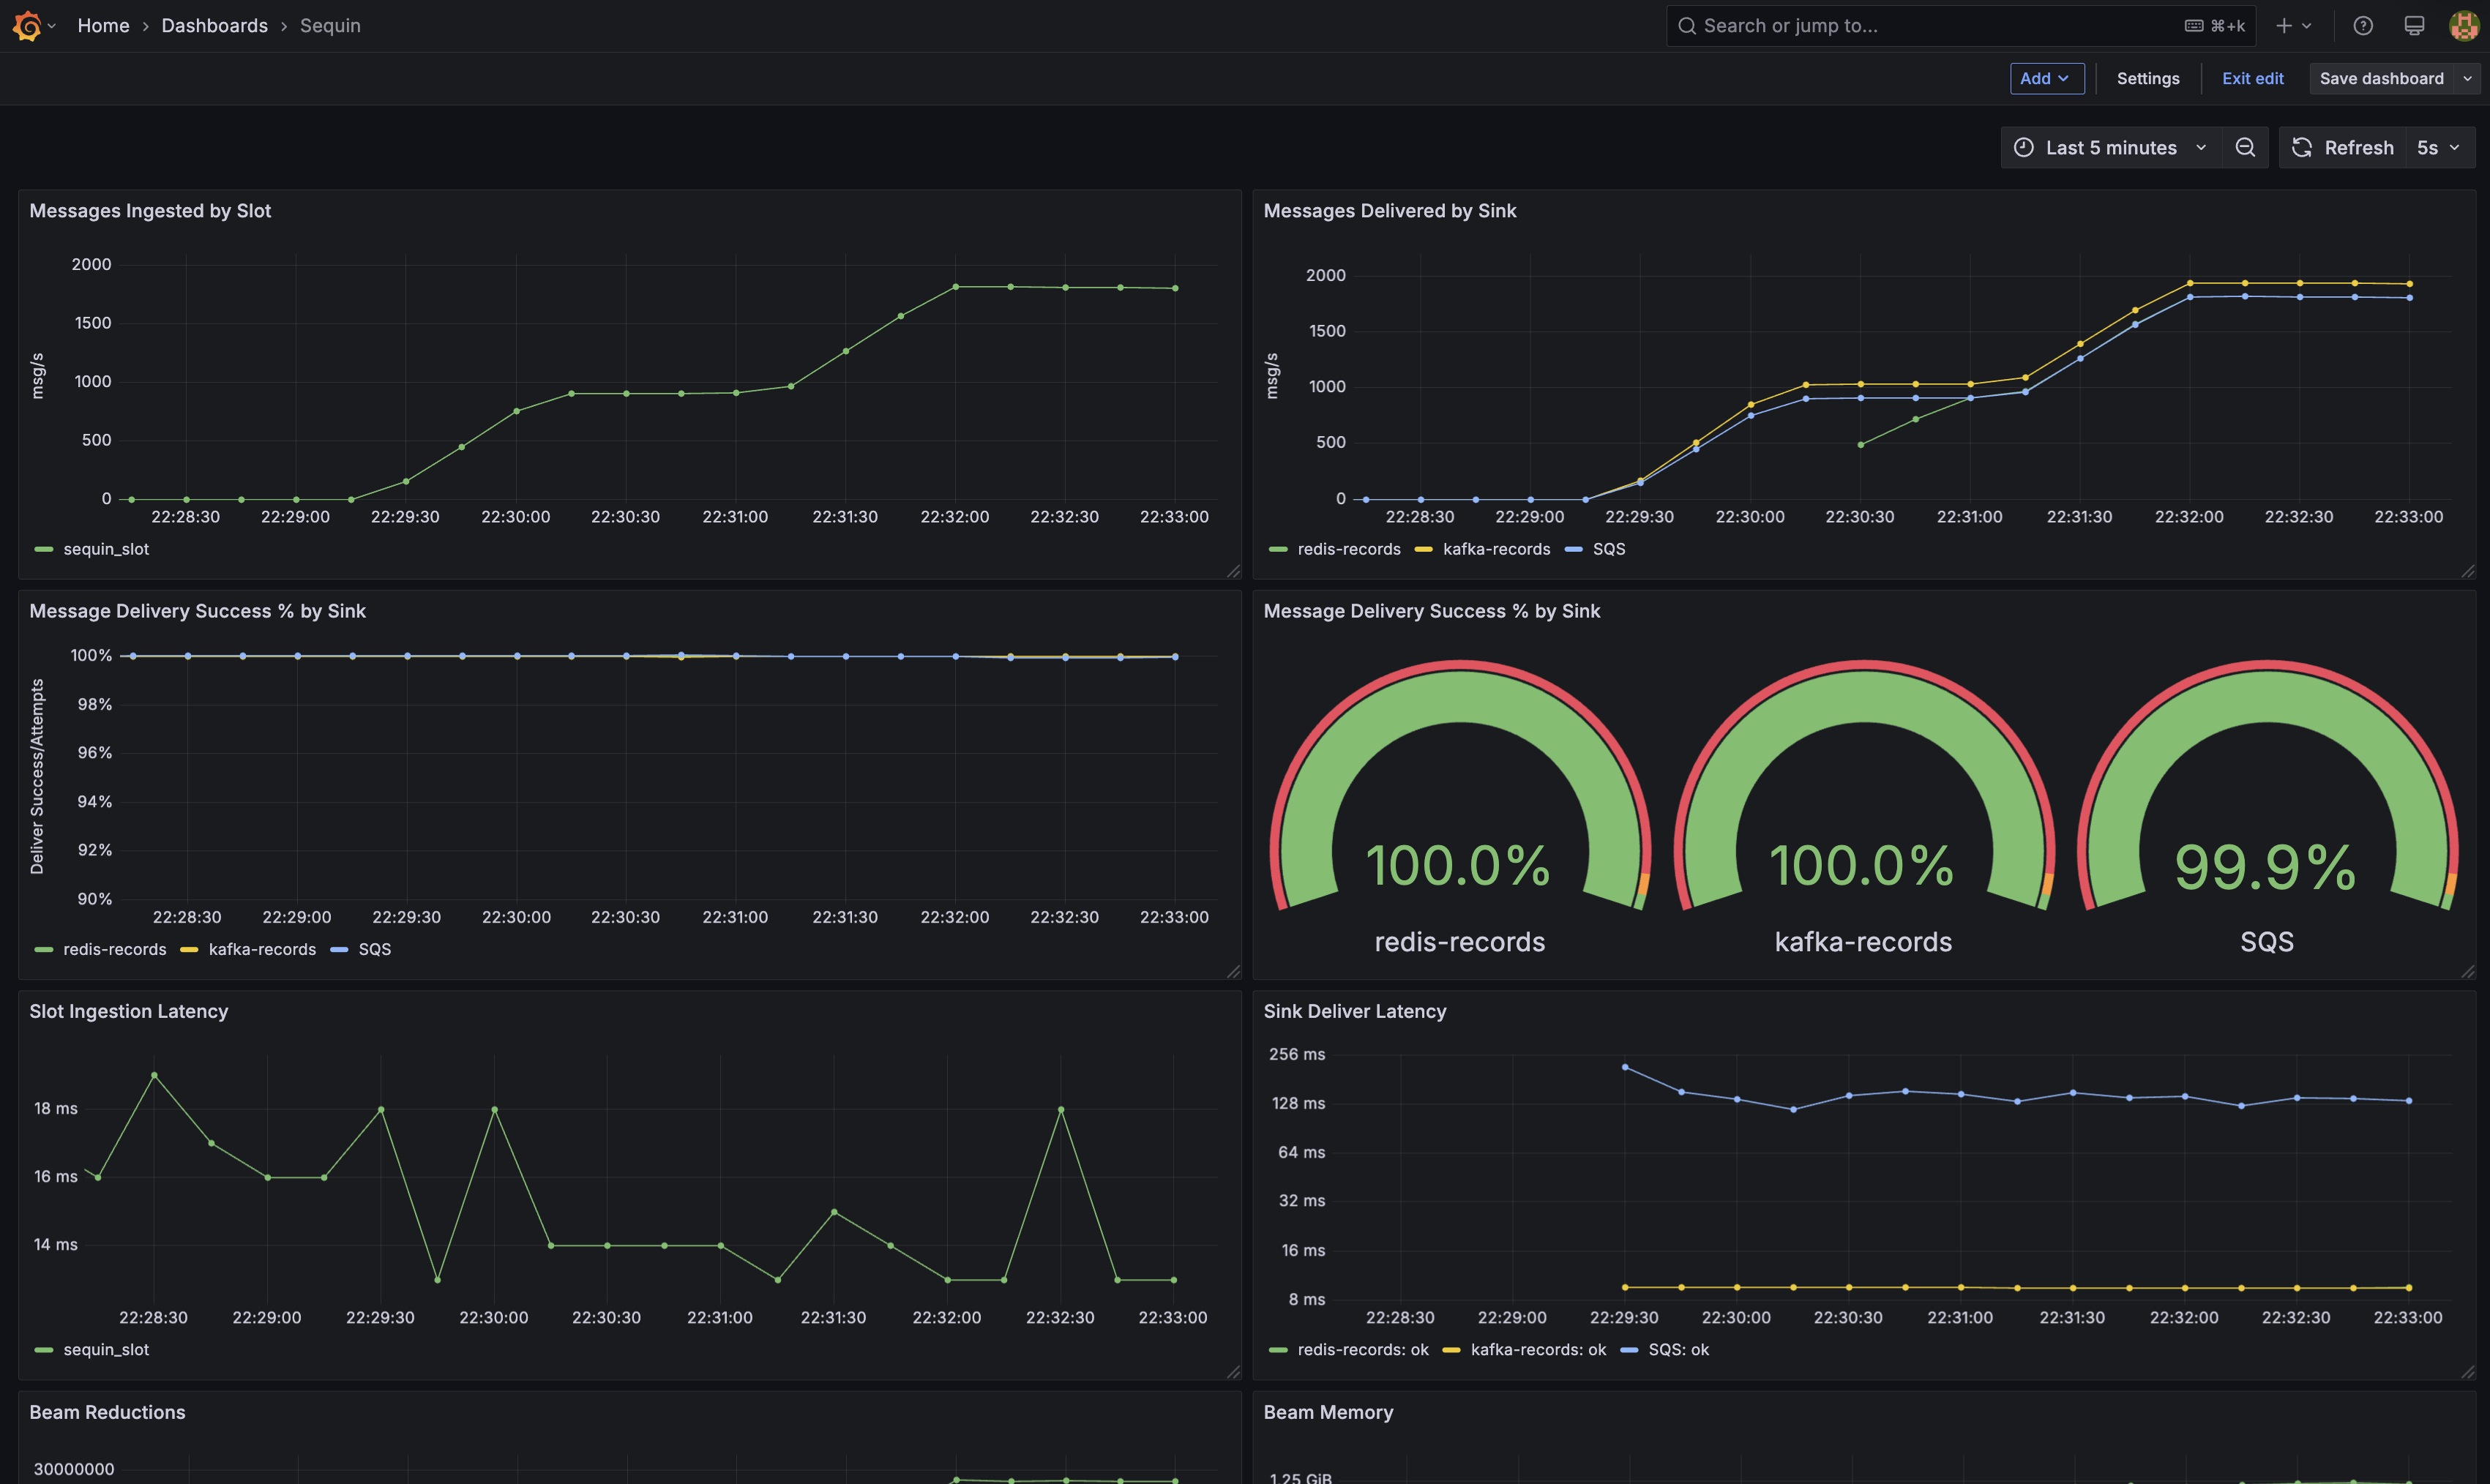
SEQUIN_METRICS_USER and SEQUIN_METRICS_PASSWORD environment variables and Sequin will automatically require these credentials. See the Configuration reference for details.- Is Sequin keeping up with the database? (Ingestion metrics)
- Is Sequin processing messages quickly? (Internal processing metrics)
- Are sinks keeping up with Sequin? (Delivery metrics)
- Is the Sequin service experiencing CPU or memory pressure? (VM metrics)
Metrics reference
Ingestion metrics
-
sequin_ingestion_latency_us(Gauge) Measures latency between transaction commit and when Sequin first receives it. Calculated by instrumenting Sequin’s own heartbeat messages. -
sequin_messages_ingested_count(Counter) Number of messages Sequin has received from a given replication slot. -
sequin_replication_slot_size_mb(Gauge) Size of the Postgres replication slot in megabytes, calculated via:
Internal processing metrics
-
sequin_internal_latency_us(Histogram) Measures time between Sequin ingesting a message and beginning to process it.
Delivery metrics
-
sequin_delivery_latency_us(Histogram) Measures time between Sequin beginning to deliver a message and a given sink’s successful acknowledgement. Some sinks are able to batch messages, in which case this metric measures the batch latency, rather than the per-message latency. -
sequin_message_deliver_attempt_count(Counter) Incremented for each message Sequin tries to deliver, before receiving a success or failure response. -
sequin_message_deliver_success_count(Counter) Incremented for each message that Sequin successfully delivers. -
sequin_message_deliver_failure_count(Counter) Incremented for each message that Sequin fails to deliver to a sink. This is because the sink was either unreachable, timed out, or returned an error.
Total latency
The total latency from database commit to message delivery is the sum of the ingestion latency, internal processing latency, and delivery latency.
VM metrics
Sequin is implemented with Elixir. Elixir’s VM (the BEAM) exposes many metrics. The following are the ones we find most useful for monitoring Sequin:-
erlang_vm_statistics_reductions_total(Counter) Measures how many VM instructions are executed across all processes. Shows intensity of CPU-bound work. Recommend using with a rate query rather than directly. -
erlang_vm_memory_bytes_total(Gauge) Memory usage of the entire VM.
Entity health
-
sequin_entity_health(Gauge) Tracks the health status of various Sequin entities (sinks, databases, and replication slots). Labels:entity_type- Type of entity (sink,database,replication_slot)entity_id- UUID or name of the entitystatus- Current status label (ok,warn,error,paused)
ok- Entity is healthy and operating normallywarn- Entity has warnings but is still operationalerror- Entity is experiencing errors and may not be functionalpaused- Entity is intentionally paused or disabled
Example PromQL for alerting on error:Example Grafana panel query to count entities in error state: